During the past 10 days or so the market is finally realizing what we’ve been saying about #Plant19 – We ain’t gonna see a 15Bbu crop…and perhaps not even a 14Bbu crop!
It feels like we’re rallying like it’s 2010 all over again, but we all need to step back and remember that this only gets new-crop prices back to levels that were available several times between NOV and FEB.
The major questions I get asked right now are “how high is it going to go??” and “when’s this going to end?
Obviously, nobody knows the answer to either…
However, I tried to put the current corn situation into perspective using the following charts…
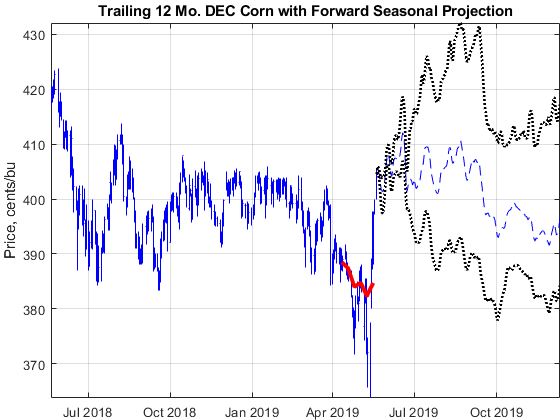
Due to the “correlation” weighting on the seasonal projection, the range of outcomes is getting wider due to the recent upward burst in price, and the entire projection curve has shifted upward to where the new upper-range target is projected around $4.30/bu CZ’19
The averaging contract is now lagging the market by nearly 30 cents at $3.85 CZ’19
Due to the “bullspreading” effect (i.e. front-much futures moves up more quickly), the market is essentially “flat” all the way through CZ’21.
AT WEEK 20 THE NATIONAL CORN PLANTING PROGRESS WAS ONLY 49%…LITERALLY THE SLOWEST ON RECORD (DATA GOES BACK TO 1980).
The blue line highlighted in the above chart shows the progress in the spring of 1995, the most similar year at this point in terms of planting pace.
This table shows the planting progress data since 1980 in tabular form. I selected the 8 most similar years (highlighted in green) to see what happened to prices in those years.
The approximate timing of the APR-JUNE market high is highlighted in orange.
In 1993 and prior, the APR-JUNE high was made early in planting season
In 1983, 1993, and 1995 the market subsequently went on to make much higher highs as other conditions further tightened expected supply (late-season drought, new demand, 1993 floods, etc.)
Since 1995, the APR-JUNE highs have all been made shortly after the planting progress crossed 90%
By taking the futures data from those 8 years, and re-scaling to match current prices, we can visualize what would happen from today if prices changed by the same percentages going forward.
The average price curve (black line) peaked around May 30th
6 of the 8 years would have hit a $4.24 target from here, and half of the years would have made $4.40 CZ’19
Based on these results, and because I am concerned that we could see an unprecedented volume of prevented plant claims, I moved my $4.14 target up to $4.24, but left my targets at $4.39 and $4.49 alone for now.
At this point I am still carrying two CN’19 call options which will expire on June 21st. I expect to liquidate the options in mid-June, but haven’t decided yet on what will be the trigger (might just be a gut feeling sort of thing…but we’re using the house’s money on the calls at this point, so not much risk there).
Depending on how things evolve, I may either buy more calls (to cover more sales), or roll out/down the existing calls into SEP delivery.
Update 5/24/19: Bot two more calls on 5/23, then another four this morning…all CN’19…
If you are still selling old-crop corn, consider selling more NOW, then make a concrete plan to have it gone by June 21st. An easy strategy would be to just divided your remaining inventory into quarters and sell some each week.
As long as you either have your corn planted, or are very confident you will get it done, I don’t see anything wrong with getting half sold on a conservative yield at this point for next year during this move.
If you want to be more heavily sold, or the current market action makes you nervous, you can use a minimum price contract to establish a floor while leaving the upside open (on just a portion of your sales)…or you could buy put options if you have your own brokerage account.
At our elevator, you can always convert an existing sales contract into a min-price contract as long as the contract has not been settled.
For corn you’ll have in a bin, the market is still paying some carry out to July 2020, so you can earn some premium just selling a straight cash contract for delivery next spring. Otherwise, sell a DEC’19 or MCH’20 HTA. If the carry completely goes away, empty your bins early, pocket the cash, and re-fill them with sailboat fuel!
SOYBEAN MARKET UPDATE:
Last week it looked as if beans might rally along with corn, but on Friday morning the Chinese pretty much said “up your’s” to POTUS Trump, and now trade talks seem to be slipping further away (for awhile). The announcement immediately whacked soybeans for another dime or two.
At three weeks in the soybean averaging contract is at $8.66 SX’19
I am hearing from my trusted sources that there is a credible risk of China cancelling the rest of their un-shipped soybean purchases. If this happens, the expected soybean carryout would balloon to >1.2Bbu, and perhaps a new record stocks/use ratio.
If you have old-crop beans to sell, I think a reasonable plan would be to just sell 20% every week for the next 5 weeks. One way or another, the soybean planting progress should hit 100% in that time, and at that point I would typically expect the market to remove more risk premium…(another kick to the groin).
I feel pretty much the same way about new-crop, but I’d probably only work with 50-70% of your expected production. Beans always have a way of making me look stupid, so I want to keep some beans back to price in case of a miracle. However, if selling cash beans for $6.25 would put you out of business, you need to be selling some now to make sure you won’t be trapped into that box.